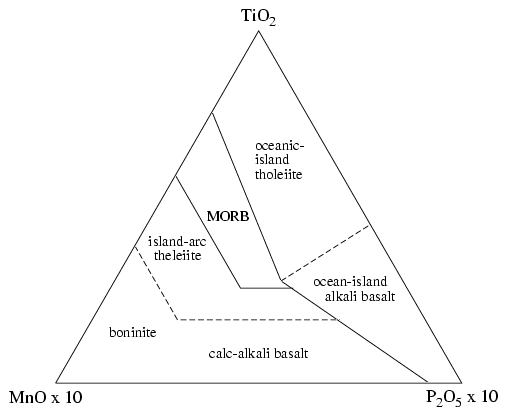

# The MnO-TiO2-P2O5 discrimination diagram for basalts and

# basaltic andesites (45-54 wt% SiO2) (after Mullen, 1983)

#

# 07-10-2001 by IWW <warmada@altavista.net>

#

set term postscript enhanced monochrome 'Roman' 10.5

set output 'diskrim.ps'

set size square 0.535,0.65

set angle degrees

set noborder

set xrange [-10:100]

set yrange [-10:100]

set noxtics

set noytics

set key 100,90


# plot triangular coordinate system


#gx(x,y) = x + y * cos(60)

gx(x,y) = 100 - (x + y) + y * cos(60)

gy(x,y) = y * cos(30)


set label 41 'MnO x 10' at -2.5,-3.5 center font 'Times,12'

set label 42 'TiO_2' at 50,90 center font 'Times,12'

set label 43 'P_2O_5 x 10' at 100,-3.5 center font 'Times,12'


set label 44 'oceanic-' at 49,58.5 left

set label 45 'island' at 49,55 left

set label 46 'tholeiite' at 49,51.5 left


set label 47 'MORB' at 42.5,41 center


set label 48 'island-arc' at 30,35 center

set label 49 'theleiite' at 30,31.5 center


set label 50 'ocean-island' at 72.5,25 center

set label 51 'alkali basalt' at 75,21.5 center


set label 52 'boninite' at 19,12.5 center

set label 53 'calc-alkali basalt' at 50,7.5 center


plot 'diskrim.dat' index 1 using (gx($1,$2)):(gy($1,$2)) notitle with lines 1, \

     'diskrim.dat' index 2 using (gx($1,$2)):(gy($1,$2)) notitle with lines 2, \

     'diskrim.dat' index 0 using (gx($1,$2)):(gy($1,$2)) notitle with lines 1

#pause -1

reset


# data arrangement (diskrim.dat)

# ------------------------------

# each data cluster should be separated by 2 LS

# that is gnuplot syntax for plotting with index

# boundary lines for triangle

# index 0

100   0   0

  0 100   0

  0   0 100

100   0   0


# MnOx10  TiO2	P2O5x10

# solid line

# index 1

23 	77  	0

30 	29 	41

 8  	0 	92


41 	59  	0

41 	27 	32

28 	27 	45


# dashed line

# index 2

61 	39  	0

61 	18 	21

21 	18 	61


30 	29 	41

 0 	45 	55